
此篇已是Glance相关的第4篇了,之后“Glance仪表盘定制”这个话题也可以告一段落,本篇主要介绍Glance ECharts组件和n8n的使用。
Glance目前还没有图表组件供我们自定义图表……iframe响应相对较慢,最近,我也尝试了直接在Glance中嵌入ECharts,目前已经初步成功工作了。要在Glance的yaml文件中配置ECharts并不是明智之举,数据的输入要严格遵守ECharts所需的配置格式,因此n8n仍然是最容易的方法:使用API获得数据后,通过Code节点组织成ECharts所需格式,通过Webhook传给Glance。项目地址为 GitHub - osnsyc/glance-echarts
此前3篇文章地址:
快速开始 #
git clone https://github.com/osnsyc/glance-echarts.git
cd glance-echarts
go build -o build/glance .
./build/glance --config ./docs/glance-echarts.yml
data或data-url获取的JSON数据将传入ECharts的option中,只需按照ECharts的option格式组织数据即可。
- type: echarts
  title: radar
  height: 300
  cache: 1h    # default 10m, 1d/2h/3m
  theme: light # default dark, light/dark
  data: >
    {"legend":{"data":["Budget","Spending"]},"radar":{"indicator":[{"name":"Sales","max":6500},{"name":"Administration","max":16000},{"name":"Information Technology","max":30000},{"name":"Customer Support","max":38000},{"name":"Development","max":52000},{"name":"Marketing","max":25000}]},"series":[{"name":"Budget vs spending","type":"radar","data":[{"value":[4200,3000,20000,35000,50000,18000],"name":"Allocated Budget"},{"value":[5000,14000,28000,26000,42000,21000],"name":"Actual Spending"}]}]}
- type: echarts
  height: 300
  data-url: http://ENDPOINT_WHERE_HOSTING_THE_JSON_FILE
关于如何托管JSON文件,请移步《 信息归处,一目了然 —— Glance仪表盘定制心得》的“JSON数据的便捷托管方式”章节。
配置项 #
以下提供了一个典型的option数据,完整的配置可以查看官方文档 Apache ECharts - 配置项
{
  "legend": {
	"data": [
	  "Budget",
	  "Spending"
	]
  },
  "radar": {
	"indicator": [
	  {
		"name": "Sales",
		"max": 6500
	  },
	  {
		"name": "Administration",
		"max": 16000
	  },
	  {
		"name": "Information Technology",
		"max": 30000
	  },
	  {
		"name": "Customer Support",
		"max": 38000
	  },
	  {
		"name": "Development",
		"max": 52000
	  },
	  {
		"name": "Marketing",
		"max": 25000
	  }
	]
  },
  "series": [
	{
	  "name": "Budget vs spending",
	  "type": "radar",
	  "data": [
		{
		  "value": [
			4200,
			3000,
			20000,
			35000,
			50000,
			18000
		  ],
		  "name": "Allocated Budget"
		},
		{
		  "value": [
			5000,
			14000,
			28000,
			26000,
			42000,
			21000
		  ],
		  "name": "Actual Spending"
		}
	  ]
	}
  ]
}
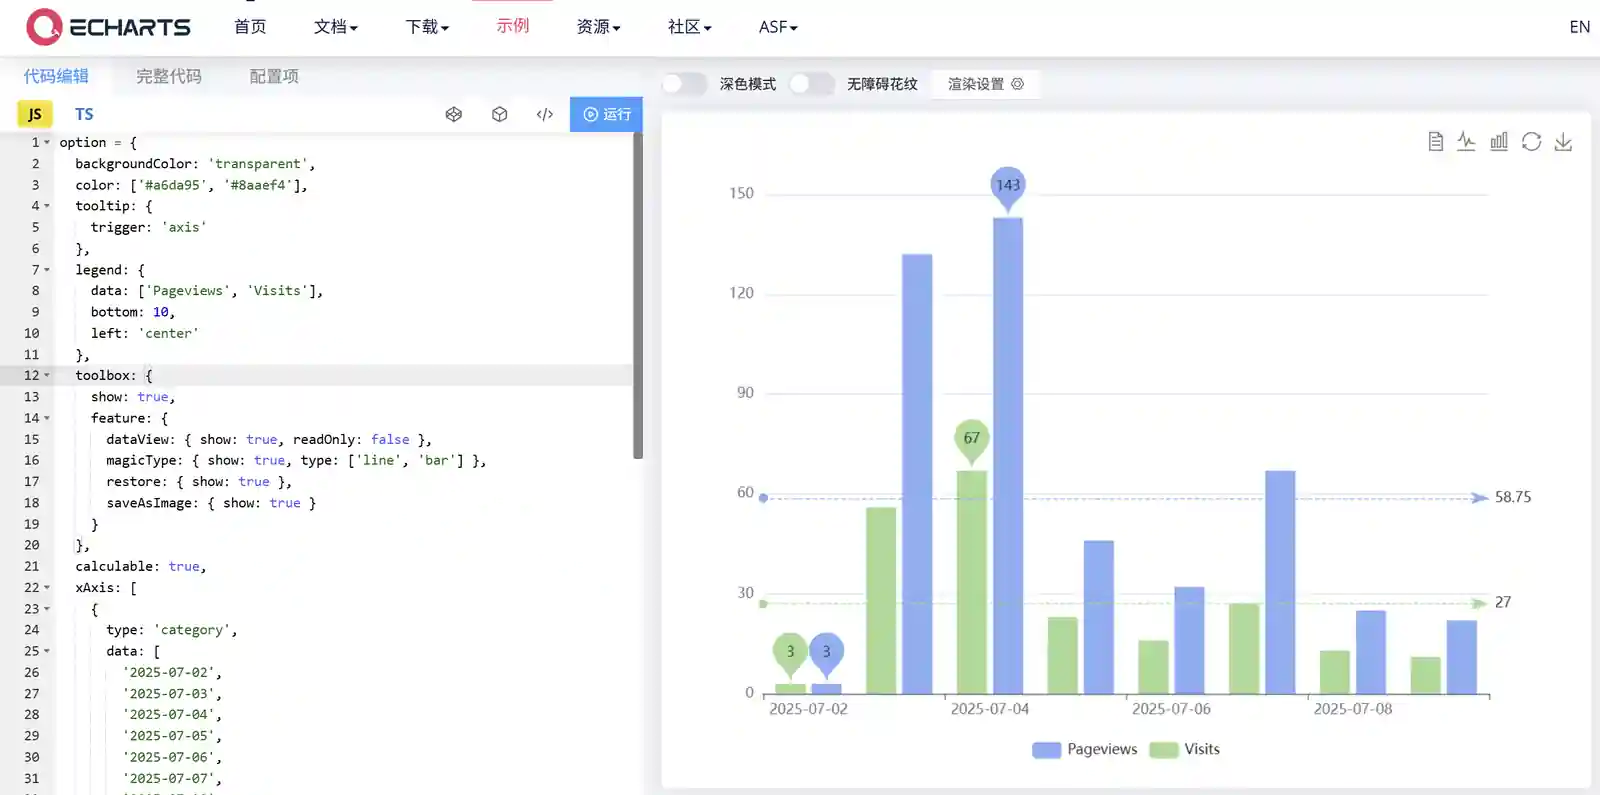
我们可以将自己的option配置项复制到官方的示例中 Examples - Apache ECharts进行实时预览。
n8n流程 #
n8n集成了很多应用接口,能便捷的获取数据,ECharts虽然配置繁多,但option数据高度结构化,AI可以很高效地帮我们写Code节点代码来处理输入的数据,提示词也很简单。
样式 - 调色盘 #
先来统一样式。ECharts的颜色样式可以通过颜色主题(Theme)、调色盘、直接的样式设置和visualMap组件设置,我是用的是调色盘方式,如下:
option = {
  color:['#c23531','#2f4554','#61a0a8','#d48265','#91c7ae','#749f83','#ca8622','#bda29a','#6e7074','#546570','#c4ccd3'],
}
我以Glance的positive-color和primary-color作为两个基础颜色,在两个颜色的HSL路径连线上生成调色盘(即均匀过渡)。但ECharts的颜色拾取有个缺陷,颜色为顺序读取使用,那么如果调色盘预制的颜色和系列数量不匹配时,会导致:
- 若,调色盘颜色数»系列数,系列颜色只拾取靠近
positive-color的颜色,造成系列颜色区分度不高; - 若,调色盘颜色数<系列数,系列颜色按默认拾取其它颜色,造成图表颜色突兀。
为所有图表设置统一的主题或调色盘视觉效果不佳,那么就为每一个系列单独生成调色盘。在n8n流程中设置一个子流程,可由其它流程调用,输入为调色盘颜色数量-n,输出为调色盘-palette。将以下代码直接在n8n画布中粘贴即可使用:
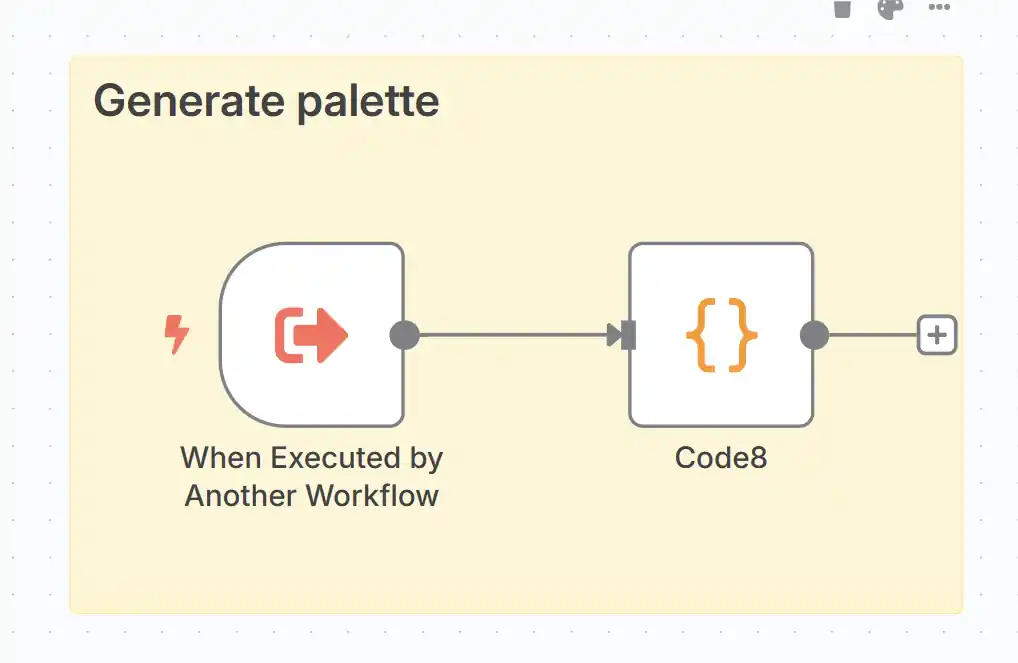
{
  "nodes": [
    {
      "parameters": {
        "jsCode": "const start = { h: 105, s: 48, l: 72 };\nconst end   = { h: 220, s: 83, l: 75 };\n\nconst n = $input.first().json.colorNum;\n\nfunction interpolateHue(h1, h2, t) {\n  const delta = ((((h2 - h1) + 540) % 360) - 180);\n  return (h1 + delta * t + 360) % 360;\n}\n\nfunction hslToRgb(h, s, l) {\n  s /= 100;\n  l /= 100;\n  const c = (1 - Math.abs(2 * l - 1)) * s;\n  const hh = h / 60;\n  const x = c * (1 - Math.abs(hh % 2 - 1));\n  let r = 0, g = 0, b = 0;\n\n  if (hh >= 0 && hh < 1) [r, g, b] = [c, x, 0];\n  else if (hh < 2) [r, g, b] = [x, c, 0];\n  else if (hh < 3) [r, g, b] = [0, c, x];\n  else if (hh < 4) [r, g, b] = [0, x, c];\n  else if (hh < 5) [r, g, b] = [x, 0, c];\n  else [r, g, b] = [c, 0, x];\n\n  const m = l - c / 2;\n  return [\n    Math.round((r + m) * 255),\n    Math.round((g + m) * 255),\n    Math.round((b + m) * 255)\n  ];\n}\n\nfunction rgbToHex(r, g, b) {\n  return '#' + [r, g, b].map(x => x.toString(16).padStart(2, '0')).join('');\n}\n\nconst palette = Array.from({ length: n }, (_, i) => {\n  const t = n === 1 ? 0 : i / (n - 1);\n  const h = interpolateHue(start.h, end.h, t);\n  const s = start.s + (end.s - start.s) * t;\n  const l = start.l + (end.l - start.l) * t;\n  const [r, g, b] = hslToRgb(h, s, l);\n  return rgbToHex(r, g, b);\n});\n\nreturn [{ json: { palette } }];"
      },
      "type": "n8n-nodes-base.code",
      "typeVersion": 2,
      "position": [
        -1000,
        -940
      ],
      "id": "354516c7-6fcf-40be-abf1-7cffe11676c2",
      "name": "Code8"
    },
    {
      "parameters": {
        "workflowInputs": {
          "values": [
            {
              "name": "colorNum",
              "type": "number"
            }
          ]
        }
      },
      "type": "n8n-nodes-base.executeWorkflowTrigger",
      "typeVersion": 1.1,
      "position": [
        -1220,
        -940
      ],
      "id": "4765429d-30b1-4dc0-9f93-96f46a3714c5",
      "name": "When Executed by Another Workflow"
    }
  ],
  "connections": {
    "When Executed by Another Workflow": {
      "main": [
        [
          {
            "node": "Code8",
            "type": "main",
            "index": 0
          }
        ]
      ]
    }
  }
}
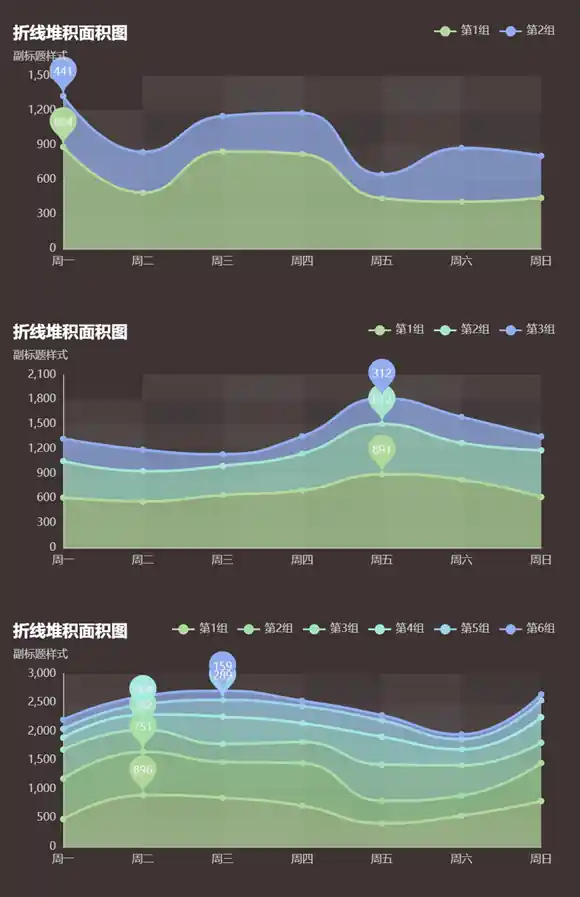
在其它的n8n流程中使用Execute Workflow节点调用该调色盘生成器,By ID填调色盘生成器的workflow id,可通过浏览器地址查看http://localhost:5678/workflow/{workflow id},colorNum填写颜色数量。以下是系列数量与调色盘数量相等,且两端色值为h: 105, s: 48, l: 72和h: 220, s: 83, l: 75生成的不同系列数的预览图。
组织数据 #
基础的流程框架是Webhook->API->Respond to Webhook。以下是3个例子,都是一个模式,当然我们也可以把头尾的Webhook替换为定时执行保存JSON至Glance的assets目录。
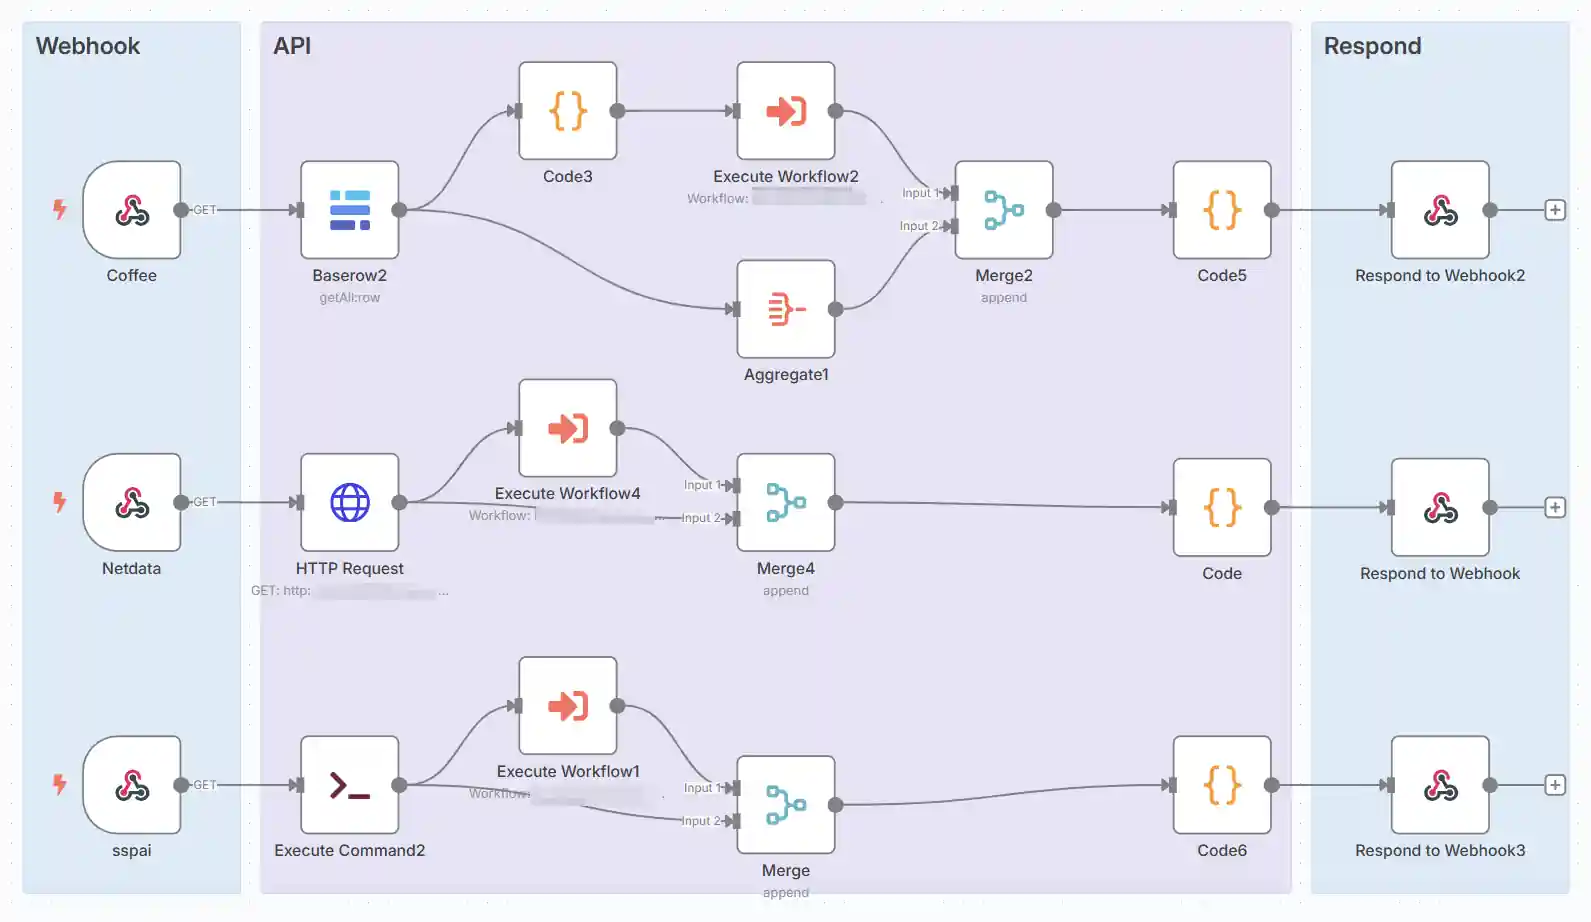
在调色盘数据和API数据的输入至Code节点前,我一般会加一个Merge节点,将两个数据拼接起来,好处是在Code节点中只需使用以下固定代码就可以赋值了,不依赖于节点名,易于复用。否则,依赖n8n的节点名赋值调试时非常麻烦,且需要手动更改节点名以理清逻辑。
const palette = $input.first().json.palette;
const rows = $input.last().json.data;
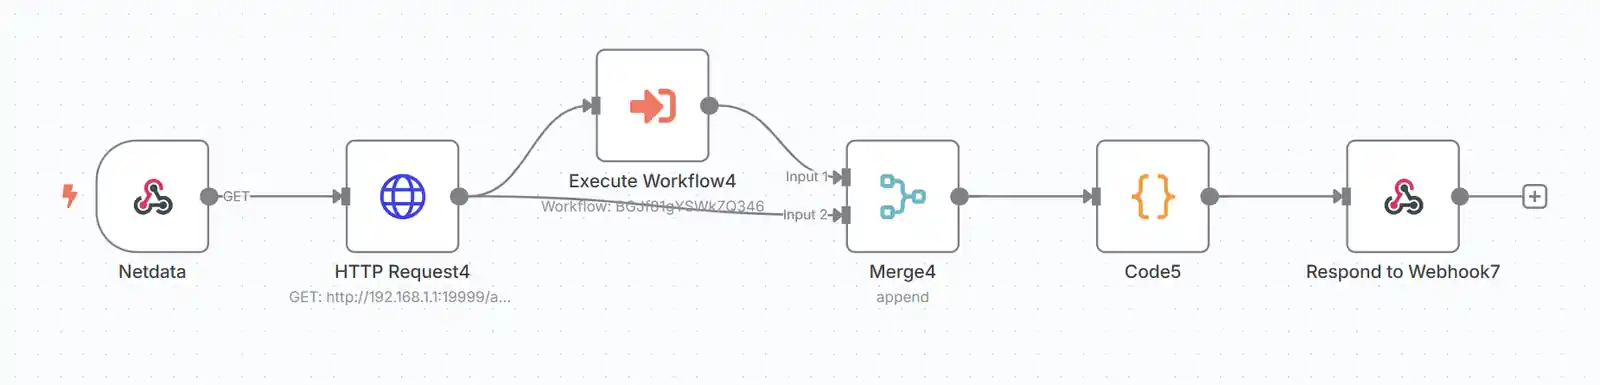
以下例子将Netdata的网速数据输出成ECarts option数据格式,直接在n8n画布中粘贴使用。读者可以以此流程为模板,按需自定义。
{
  "nodes": [
    {
      "parameters": {
        "jsCode": "const palette = $input.first().json.palette;\nconst rows = $input.last().json.data;\nconst datatime = [];\nconst datain = [];\nconst dataout = [];\n\nfor (const row of rows.reverse()) {\n  const [timestamp, received, sent] = row;\n  const time = new Date(timestamp * 1000).toLocaleTimeString();\n  \n  datatime.push(time);\n  datain.push(Number((received / 1000).toFixed(2)));\n  dataout.push(Number((Math.abs(sent) / 1000).toFixed(2)));\n}\n\nreturn [{\n  json: {\n    color: palette,\n    backgroundColor: 'transparent',\n    tooltip: {\n      trigger: 'axis',\n      axisPointer: {\n        type: 'cross',\n        animation: false,\n        label: {\n          backgroundColor: '#505765'\n        }\n      }\n    },\n    grid: {\n      bottom: 20,\n      top: 40\n    },\n    xAxis: [\n      {\n        type: 'category',\n        boundaryGap: false,\n        axisLine: { onZero: false },\n        data: datatime\n      }\n    ],\n    yAxis: [\n      {\n        name: 'In/Mbps',\n        type: 'value',\n      },\n      {\n        name: 'Out/Mbps',\n        alignTicks: true,\n        type: 'value',\n        inverse: true,\n        nameLocation: 'start',\n      }\n    ],\n    series: [\n      {\n        name: 'Inbound',\n        type: 'line',\n        areaStyle: {},\n        lineStyle: { width: 1 },\n        emphasis: { focus: 'series' },\n        data: datain\n      },\n      {\n        name: 'Outbound',\n        type: 'line',\n        yAxisIndex: 1,\n        areaStyle: {},\n        lineStyle: { width: 1 },\n        emphasis: { focus: 'series' },\n        data: dataout\n      }\n    ]\n  }\n}];"
      },
      "type": "n8n-nodes-base.code",
      "typeVersion": 2,
      "position": [
        -340,
        320
      ],
      "id": "39b15553-3f81-44c7-a653-6ec1d382dbc6",
      "name": "Code"
    },
    {
      "parameters": {
        "options": {}
      },
      "type": "n8n-nodes-base.respondToWebhook",
      "typeVersion": 1.1,
      "position": [
        -120,
        315
      ],
      "id": "6aa24a61-acc2-10e6-ab2e-4093c136bc8e",
      "name": "Respond to Webhook"
    },
    {
      "parameters": {
        "url": "http://192.168.1.1:19999/api/v1/data?chart=net.eth1",
        "options": {}
      },
      "type": "n8n-nodes-base.httpRequest",
      "typeVersion": 4.2,
      "position": [
        -1000,
        315
      ],
      "id": "c4de723b-ed98-47ae-b194-c9483acdba53",
      "name": "HTTP Request"
    },
    {
      "parameters": {
        "path": "0102d0e4-57eb-4dbc-b20f-3210005cb0be",
        "responseMode": "responseNode",
        "options": {}
      },
      "type": "n8n-nodes-base.webhook",
      "typeVersion": 2,
      "position": [
        -1220,
        315
      ],
      "id": "1b58f54c-7ca1-45c9-78b2-ba96b613a747",
      "name": "Netdata",
      "webhookId": "0102d0e4-57eb-4dbc-b20f-32a0002cb0be"
    },
    {
      "parameters": {
        "workflowId": {
          "__rl": true,
          "value": "YOUR_WORKFLOW_ID",
          "mode": "id"
        },
        "workflowInputs": {
          "mappingMode": "defineBelow",
          "value": {
            "colorNum": 2
          },
          "matchingColumns": [
            "colorNum"
          ],
          "schema": [
            {
              "id": "colorNum",
              "displayName": "colorNum",
              "required": false,
              "defaultMatch": false,
              "display": true,
              "canBeUsedToMatch": true,
              "type": "number"
            }
          ],
          "attemptToConvertTypes": true,
          "convertFieldsToString": true
        },
        "options": {}
      },
      "type": "n8n-nodes-base.executeWorkflow",
      "typeVersion": 1.2,
      "position": [
        -780,
        240
      ],
      "id": "64128a21-78a9-4112-a728-452e47e9cb8b",
      "name": "Execute Workflow4"
    },
    {
      "parameters": {},
      "type": "n8n-nodes-base.merge",
      "typeVersion": 3.2,
      "position": [
        -560,
        315
      ],
      "id": "a6917626-25b3-4925-84e5-15591e8c7053",
      "name": "Merge4"
    }
  ],
  "connections": {
    "Code": {
      "main": [
        [
          {
            "node": "Respond to Webhook",
            "type": "main",
            "index": 0
          }
        ]
      ]
    },
    "Respond to Webhook": {
      "main": [
        []
      ]
    },
    "HTTP Request": {
      "main": [
        [
          {
            "node": "Execute Workflow4",
            "type": "main",
            "index": 0
          },
          {
            "node": "Merge4",
            "type": "main",
            "index": 1
          }
        ]
      ]
    },
    "Netdata": {
      "main": [
        [
          {
            "node": "HTTP Request",
            "type": "main",
            "index": 0
          }
        ]
      ]
    },
    "Execute Workflow4": {
      "main": [
        [
          {
            "node": "Merge4",
            "type": "main",
            "index": 0
          }
        ]
      ]
    },
    "Merge4": {
      "main": [
        [
          {
            "node": "Code",
            "type": "main",
            "index": 0
          }
        ]
      ]
    }
  }
}
Code节点的数据逻辑可由AI代写。我们也可以直接将想要的官方样式代码提供给他,进行仿写。
prompt: palette和rows分别是调色盘和输入数据:const palette = $input.first().json.palette; const rows = $input.last().json.data;,row:{上一节点输入数据},帮我写一n8n的Code节点代码,将该数据处理成ECharts option配置项格式,返回json格式供下一个节点respond to webhook 调用,我希望的图表样式为ECharts area-rainfall 样式。
预览 #
前面提到了我们可以将自己的option配置项复制到官方的示例中
Examples - Apache ECharts进行实时预览。n8n预期输出的JSON格式与option格式稍有不同,直接交予AI处理。去掉前面的const,剩余的直接复制进示例即可。
prompt: 将以下数据转换成ECharts的option配置项。{“backgroundColor”: “transparent”,“color”:…
res: 以下是你提供的 JSON 数据转换成标准的 ECharts option 配置项,适用于echarts.setOption(option):const option = { backgroundColor: ’transparent’,color:
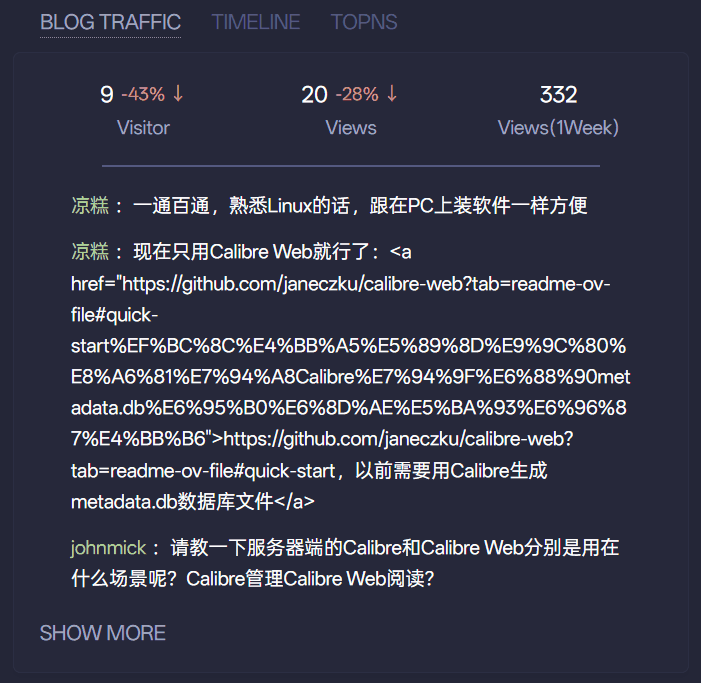
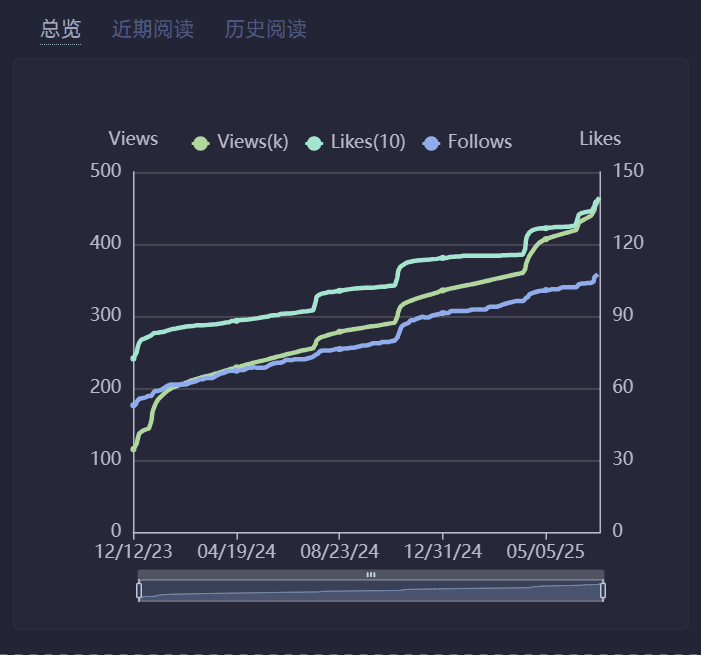
Tips #
虽然审美是一件很主观的事,但以下还是提供一个小技巧,让Glance面板更实用和协调:使用Group将同一类信息、图表堆叠起来,可按需切换,符合“一目了然”的理念。
  - type: group
	widgets:
	  - type: echarts
		title: 总览
		dark-mode: dark
		height: 350
		data-url: https://
	  - type: echarts
		title: 近期阅读
		dark-mode: dark
		height: 350
		data-url: https://
 博客数据堆叠
 少数派数据堆叠